

Each game is a story
If you pay much attention to news of any kind, it’s almost impossible to go a day without hearing about some sporting event going on in the world. Annual competitions like the Super Bowl and Major League Baseball’s World Series mark the culmination of grueling seasons for athletes and fans alike. Almost every hour of every day plays host to some sporting contest somewhere.
This wealth of contests, in part, contributes to the prominence of sports in everyday conversation, but there is another factor: sports provide great narratives. As each contest unfolds, a story is told, be it of success or failure, and many of these storylines are ones that we are familiar with: blowout thrashings, see-saw battles, comeback wins, and everything in-between. But how can we quantify, in a data driven way, what types of games we are seeing? What familiar stories they are telling? How many sport narratives are there? Five? Ten? A hundred?
Australian Rules Football as a testbed
Before we begin to answer the above questions we must decide which sport we will use to develop and test analytical techniques. For a few reasons, Australian Rules Football is a prime candidate.
First, on each scoring play either 1 or 6 points may be scored. This introduces the possibility for both small and large fluctuations in the current state of the game, while still maintaining a close link to the most elementary model we can think of: pure random walks. Second, the games are lengthy. Four 20 minute quarters make up a game but with a running clock, this amounts to two hours of gameplay on average. Third, there are many scoring events, on average about 50 per game so we might expect some rich variation.
Due to its fast paced nature, scoring events can happen within tens of seconds of one another, and this lends itself to interesting scoring trends. For those not familiar with the sport, we highly encourage you to check out some youtube highlights for yourself. (Take your time but please come back to read the rest of our post!)
We require a standard way to derive the underlying story of the game contest from the available scoring data for one game. We record the instantaneous margin (or lead) at each second of game time. This kind of time series provides the perfectly distilled “backbone” of the events taking place on the field. Here’s an example: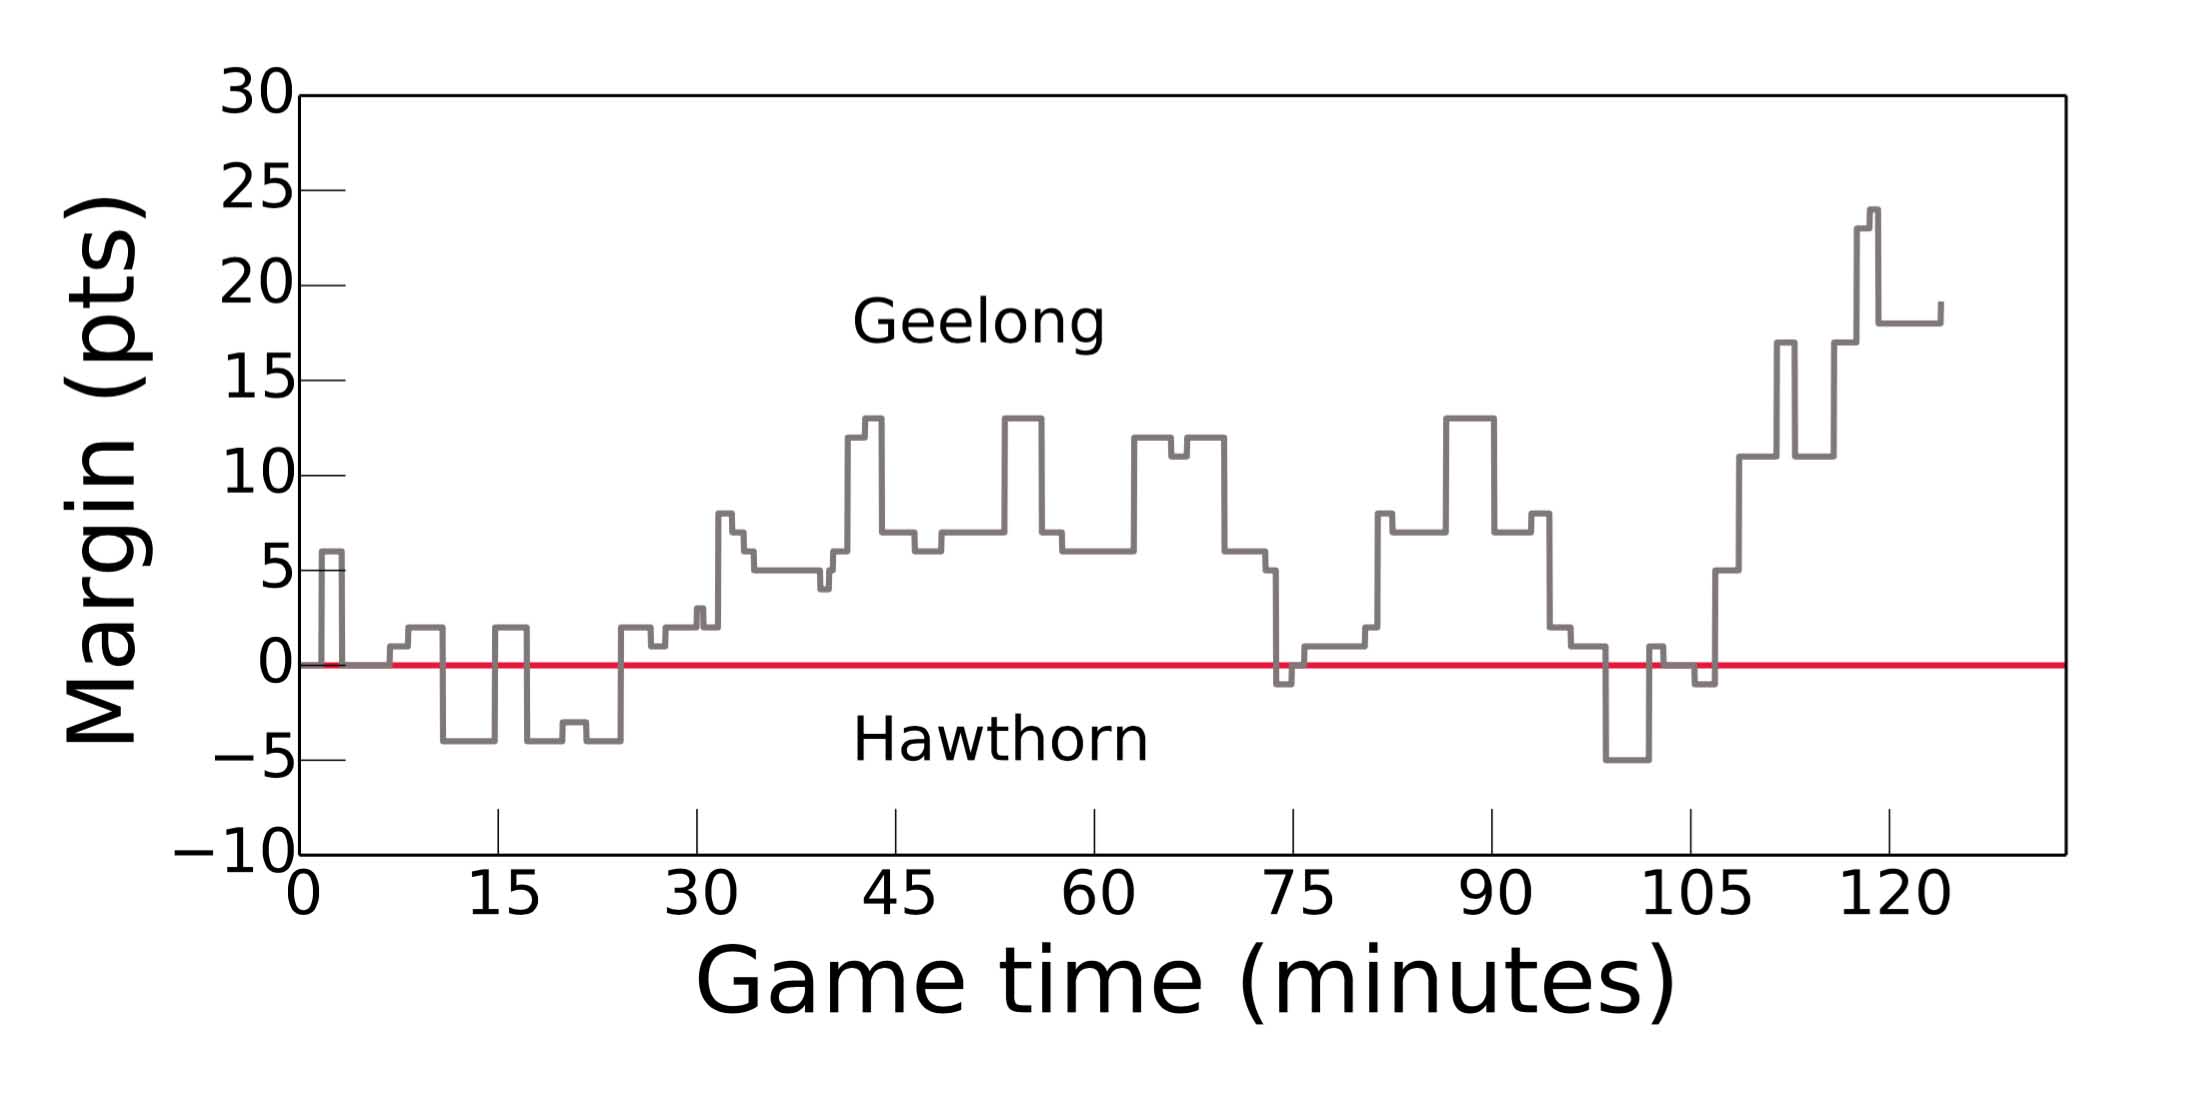
How many game shapes are there?
We compared each of these time series pairwise for over 1,300 other AFL games from the 2008-2014 seasons, allowing us to compare games. An initial, simple hierarchical clustering analysis tells us that there are two main types: blow-outs, and everything else. This intuitively makes sense, however we find that these game stories do not form well defined clusters, but rather exist on a single continuum ranging from blowout thrashings to last second, heart-stopping comebacks.
An exploration of game types
To find structure within this continuum of games, we perform a coarse-graining of game motifs with two levels of resolution, again using hierarchical clustering methods. Although these motifs do not represent well separated clusters, they nonetheless allow for the investigation of some of the more nuanced storylines with which we are most familiar within a sporting contest. Below are 71 game motifs found at the finer of the two resolutions. The highlighted motifs include both successful (#AB) and failed (#AE) massive comeback performances, blowouts (#AM), rope-a-dope (#AX), a tale-of-four-quarters (#CD), and various nail-biters (e.g., #CK).
We ran a series of simulations using a modified biased random walk model and report in the bottom right of each motif panel how many null games, on average, were most strongly associated to each motif observed in the AFL. The ratio of real/null games for each of the game motifs informs the ordering of the motifs (more prominent AFL motifs populate the first 25 stories while the last 23 are overproduced by our null model).

We invite you to read the full study in Physical Review E (requires institutional subscription or $), or on the arXiv (free!).
Looking to the future
Now, this division of game shapes is particular to Australian Rules Football. Other sports such as American Football, basketball, and baseball will likely exhibit different characteristic game story lines. Perhaps some sports are more prone to producing blowout contests or games filled with momentum changes. As a case in point, Australian Rules tiebreakers mean that scoring as much as possible in every game is rewarded, encouraging more blowouts.
What about entertainment? What types of games do fans enjoy most? Do they prefer seeing their team crush an opponent, or come from behind in a nail-biter? Do rule changes imposed by professional leagues reflect an attempt to mold game story lines to increase fan interest? Do social media discussions among fans align with our story tropes? We aim to address these questions and more with our next study where we attempt to tackle the National Football League.