
Transitioning to renewable electricity generation is an important component of the US response to climate change. However, the speed of this transition depends on factors ranging from the rates of technological innovation, market adoption, and governmental incentives. The strength of government incentives depends to some degree on public perceptions of renewable technologies, and hopefully signal of that attention and sentiment are measurable, whether from traditional polling or alternatives like social media data.
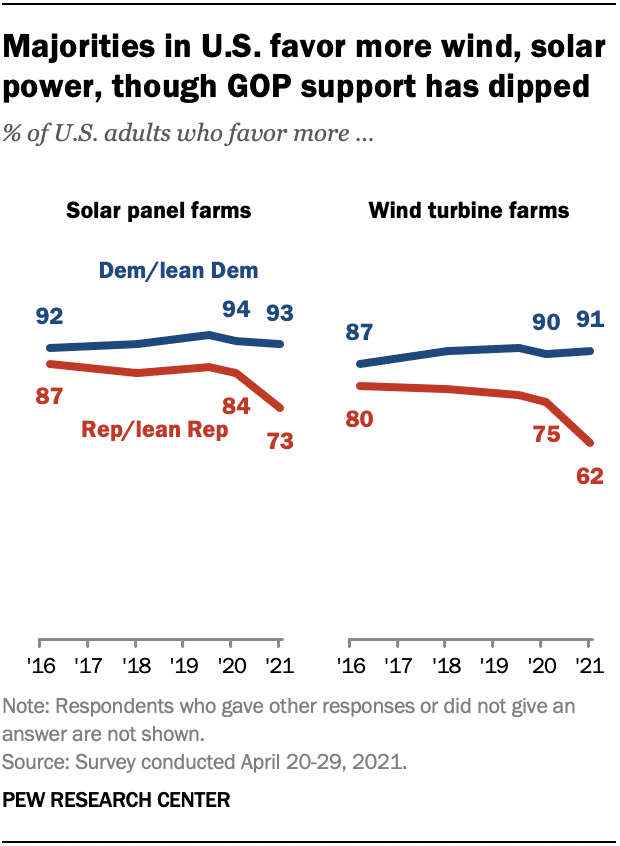
Pew Research has used traditional surveys to quantify changing support for renewables, finding mostly steady support among Democrats and declining support among Republicans.
To what extent can we replicate this result with Twitter data?
When trying to construct social media based alternatives to public opinion polling, two major challenges need to be considered during the corpus construction phase. First, are the social media posts selected expressing opinions relevant to the question of interest? And second, are the selected social media posts a sufficiently representative sample of the population of interest to those seeking to build measures that are complementary to traditional polling?
So what techniques are available for corpus curation? One common method is to create expert defined lists of keywords. These can range in complexity from matching a few relevant terms or hashtags, to complex queries selecting tweets with inclusionary and exclusionary keywords. However, this can be labor intensive, requiring both domain knowledge of the field and familiarity with the diversity of usage patterns on social media.
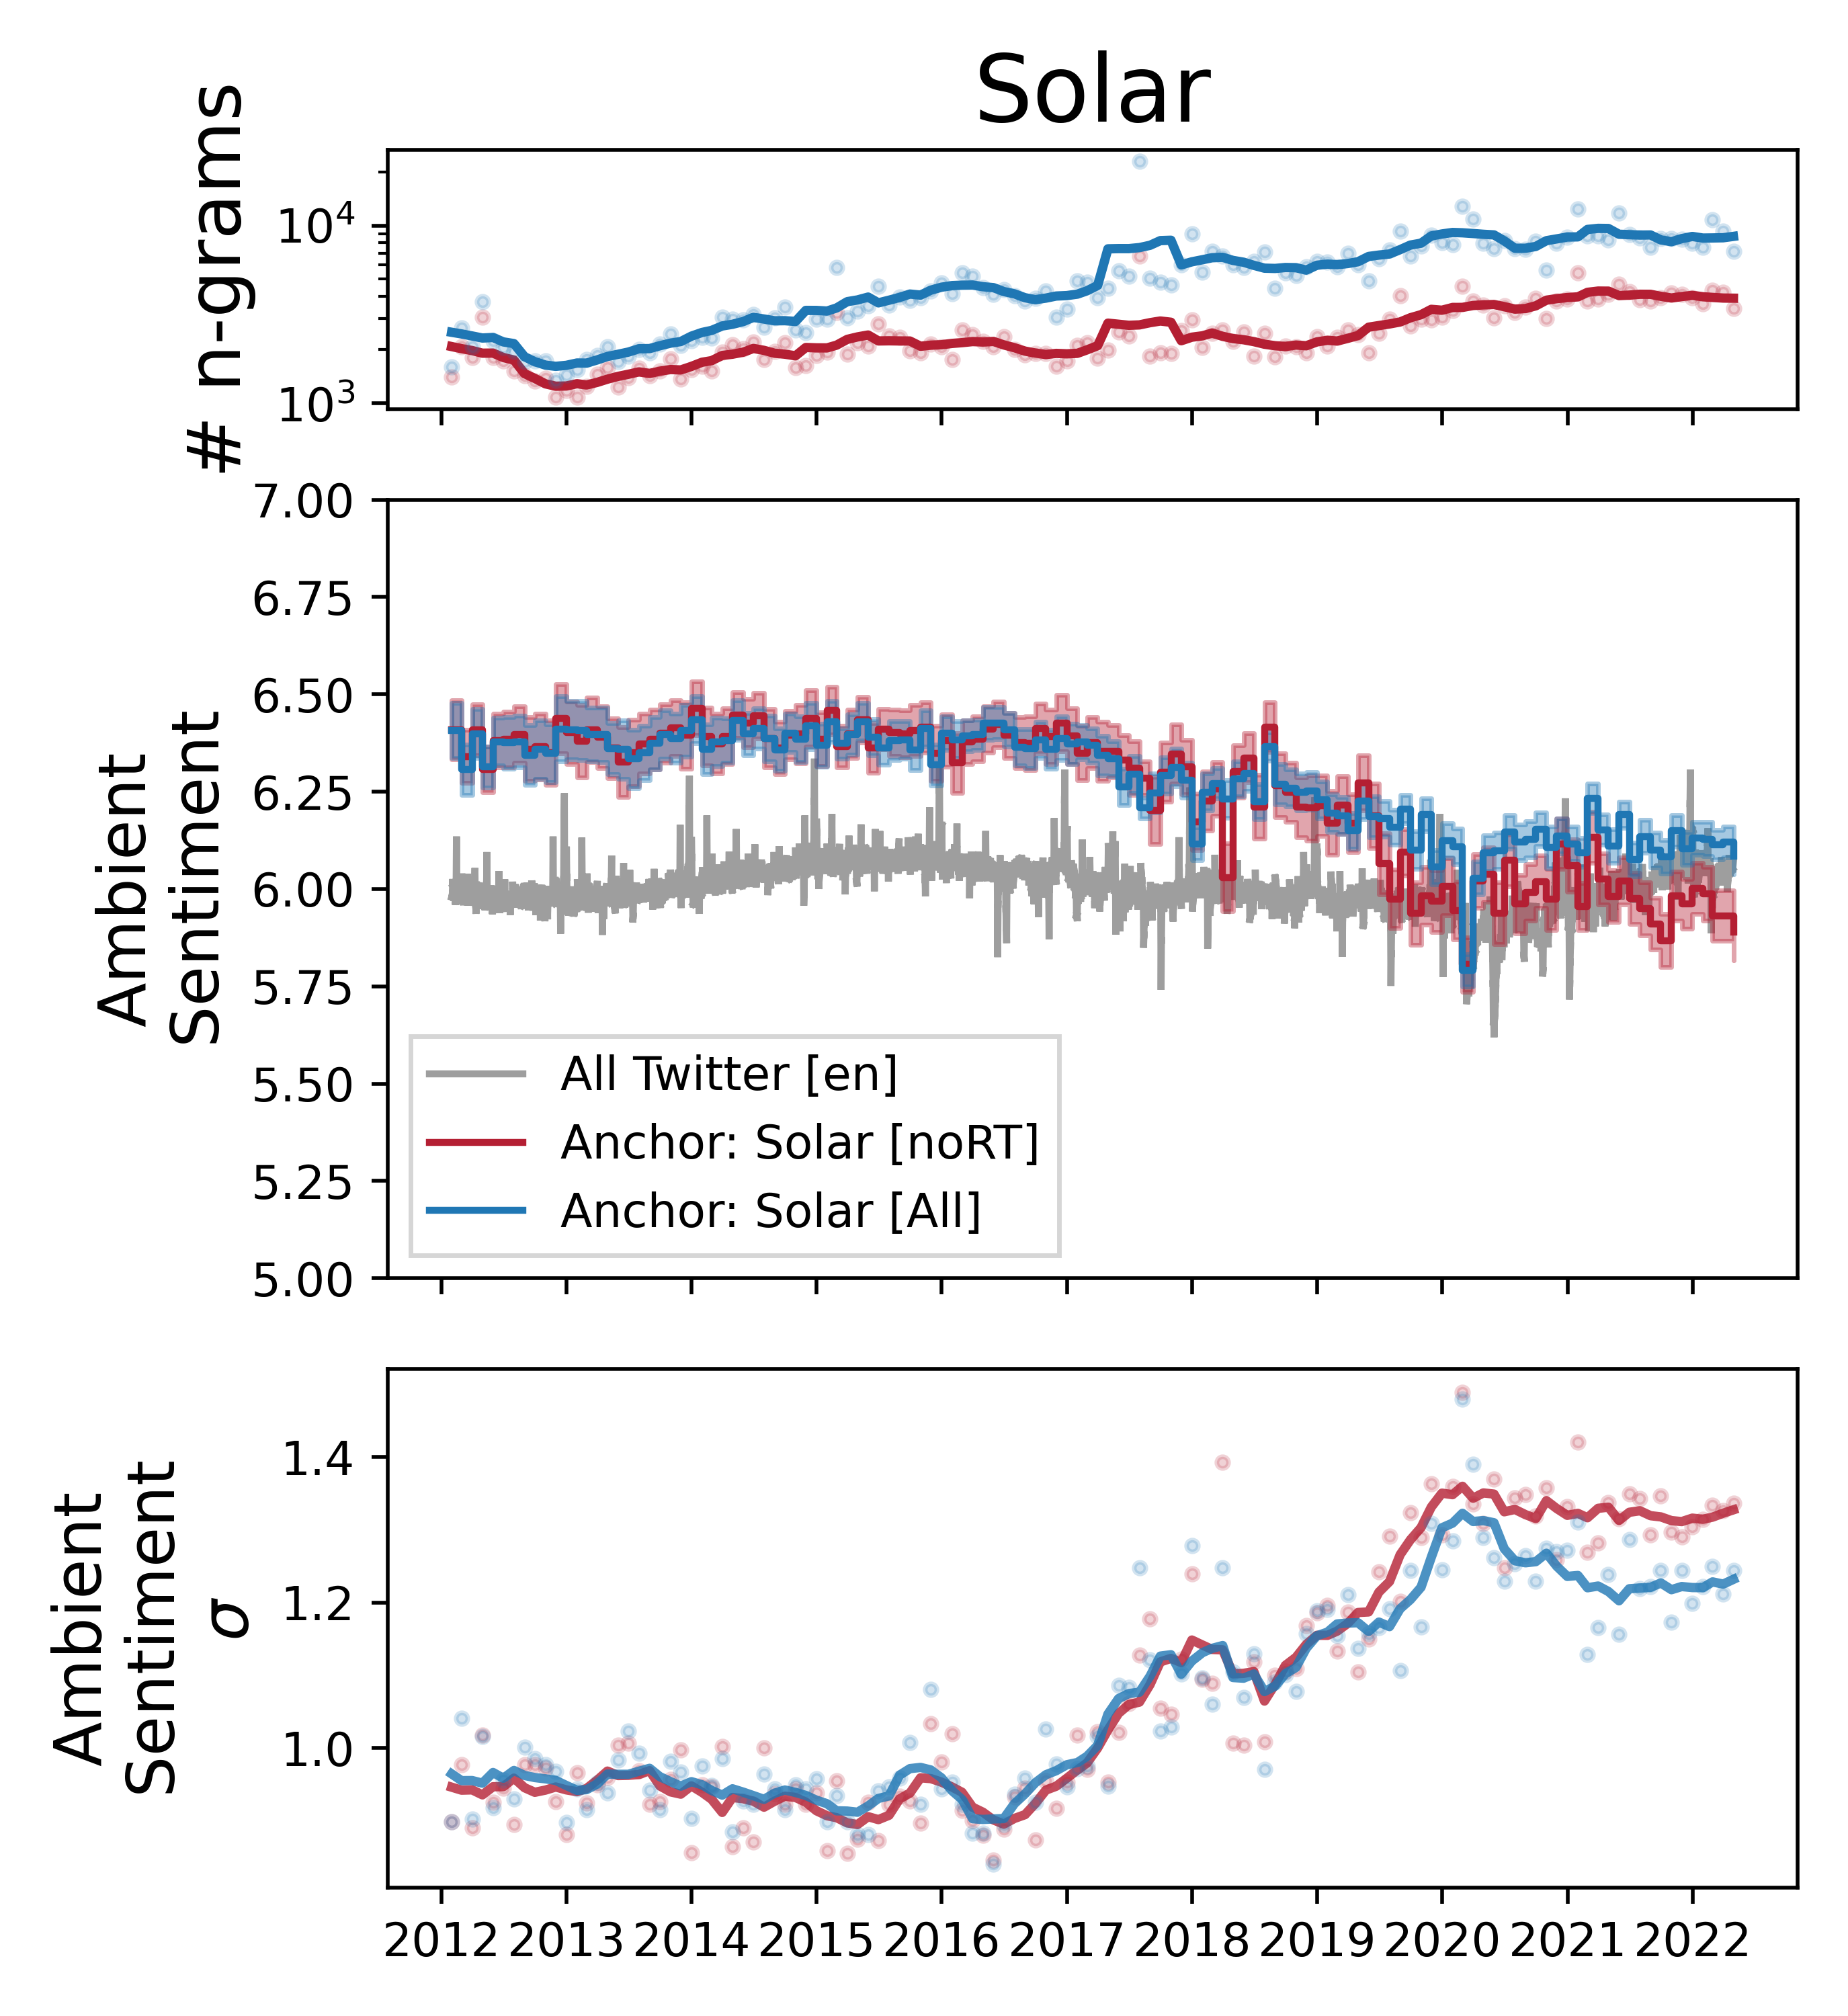
Let's try a naive query for the anchor term "solar" over the last decade on Twitter to establish a baseline sentiment measurement. We can make a few observations. With this corpus it appears that attention to solar is rising on Twitter. The average sentiment of tweets containing the anchor has been decreasing. Early on, sentiment is higher than a random sample of tweets, by ~0.30 on a scale from 1 to 9, a margin larger than the difference from an average day's tweets to Christmas day. Ambient sentiment starts decreasing noticeably after 2016, reaching a new steady state sometime in 2020, much closer to the average sentiment on Twitter. The standard deviation of sentiment also begins increasing around 2016, before leveling off at a much higher level by 2020.
But how to we evaluate the quality of our naive single keyword corpus? We might be concerned that the search term is either overly restrictive, missing an important subset of relevant conversation, or overly permissive, allowing irrelevant tweets to introduce noise or misleading signals. While subject-matter expertise is helpful in avoiding restrictive queries, we can use language model embeddings to screen our tweet corpus for irrelevant matching tweets.
The model used here for embedding is all-mpnet-base-v2, a pre-trained, permuted language model. The learning objective takes a training set of paired sentences, and when presenting one sentence to the model asks it to predict which from a set of randomly sampled sentences is the partner. The resulting embeddings attempt to represent the semantic meaning of the whole sentence or in this case, tweet.
The embeddings are represented in a 768 dimensional vector space. Visualizing tweets in this space is challenging, so we use UMAP dimensionality reduction to project into 2-D. The resulting location in this semantic space is shown below for tweets matching our naive query for Solar. An interactive plot is available, so the text of tweets will be shown when hovered over, links to the tweets will be opened on click, and it's possible to zoom into areas of interest.
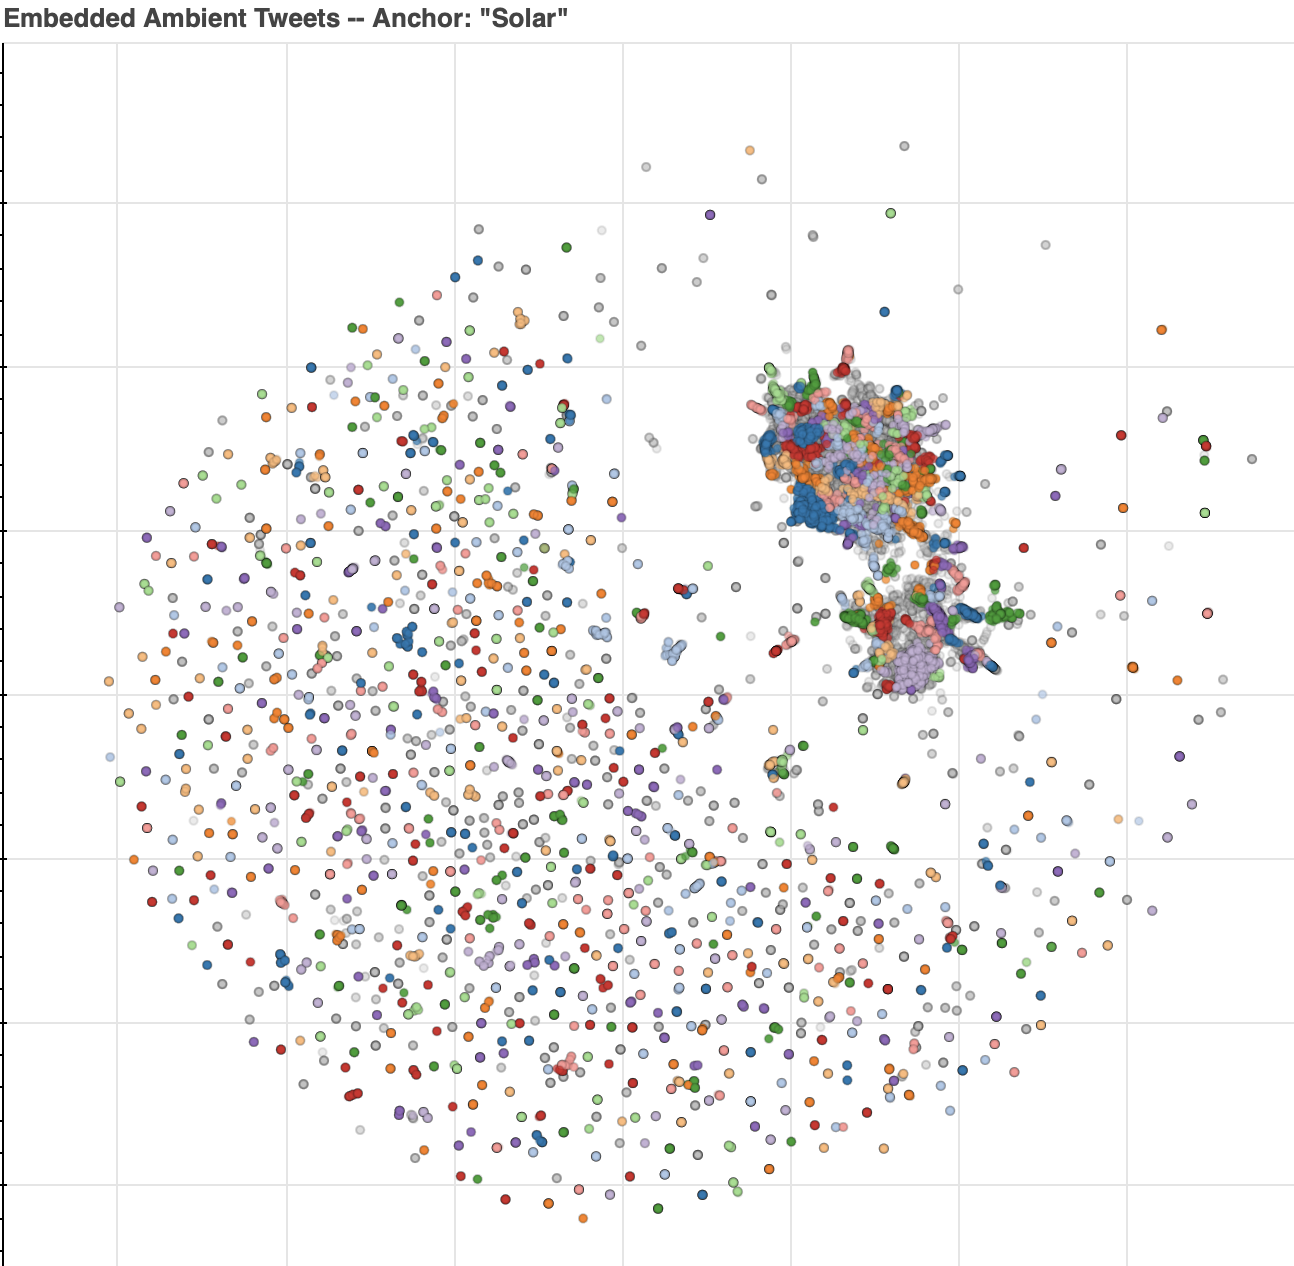
There are a few options to color the tweets in the interactive plot. The default is to color by cluster, determined by running HDBSCAN, a hierarchical, density based clustering algorithm. To explore variation in time, tweets can be colored by month. And to explore variation by location, tweets that have an associated user location can be colored by the user's state's center of population longitude coordinate.
The distribution of tweets in the embedding have some notable features. In the upper right, there are a few densely clustered areas, where the majority of human authored tweets exist. The larger cluster on top mostly contains tweets using solar in the context we want, relating to the converting light from the sun to usable electricity. Below are another few clusters relating to other contexts of the word, such as "solar system", "solar plexus", or "Solar Opposites", among others. Outside these dense clusters, there are many small, isolated bunches of tweets. These are typically weather bots or other automated accounts which tweet formulaically, and thus end up next to each other in the semantic embedding.
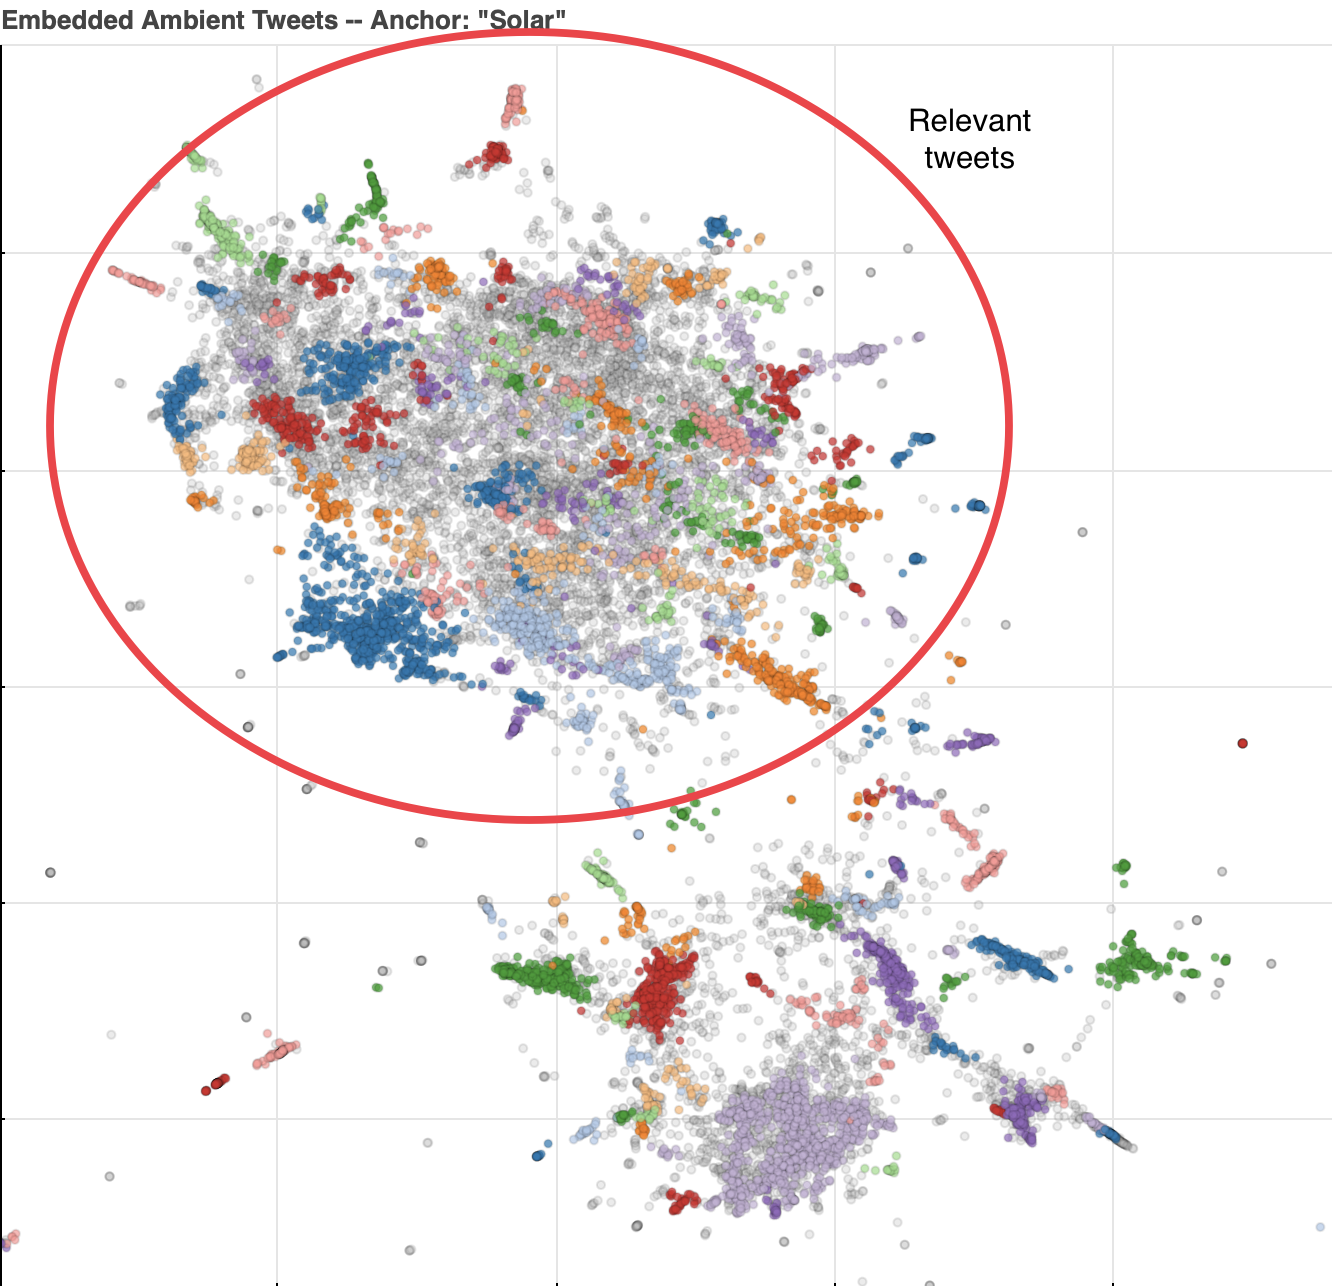
Importantly, the embedding provides good separation between relevant and non-relevant tweets, so a classifier with access to the embeddings should be able to distinguish between them. In part two of this series, we'll look at training a classifier and how using a more selectively curated corpus effects our sentiment measurement.