

As a grad student trying to understand the emotional content of some unreadably large collection of texts, a typical night can often go something like this: You’re up late at night planning a new research study, thinking about trying some of this fancy sentiment-based text analysis. You resort to your favorite search engine with the query “sentiment analysis package python.” We have all been there, except maybe with R instead of Python (the latter being my favorite).
Unfortunately, despite advances in our understanding of how to perform sentiment analysis in recent years, the first method off the shelf will rarely be the best choice. Making matters worse, it can be nearly impossible to navigate the immense literature on the topic.
Fortunately, we’ve figured out that there are only a few things that you need to know to get started using sentiment analysis.
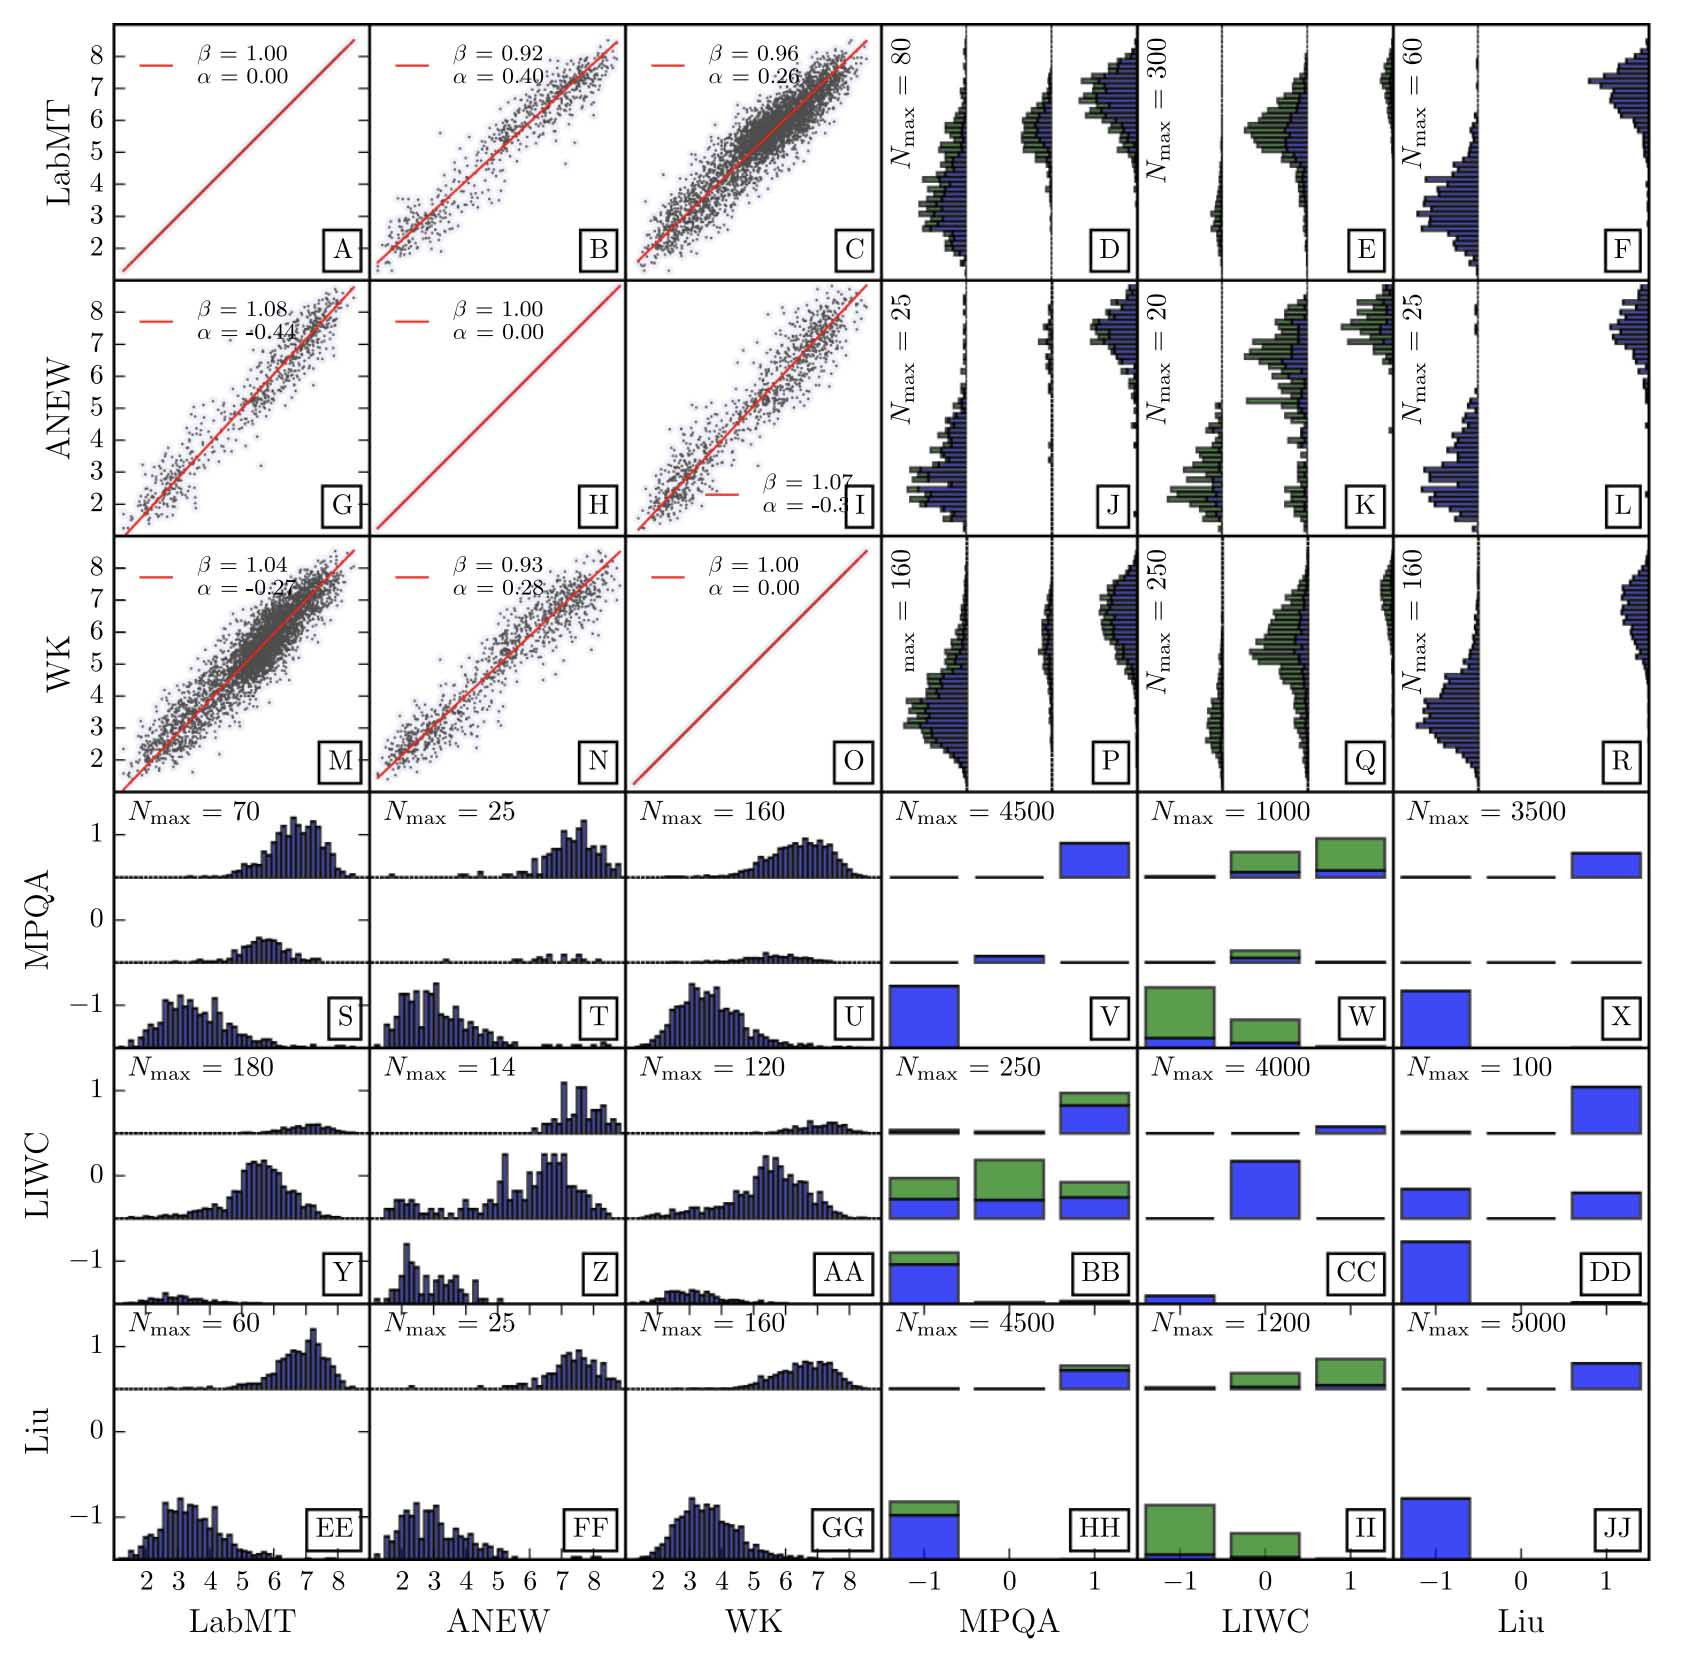
Direct comparison of the words in each of the dictionaries tested.
Using four large text corpora, we did a bake-off of sorts for dozens of tools. The methods fall into two broad categories: Supervised and unsupervised, with supervised methods relying on tagged training dataset to learn rules. Without a large training dataset, and with the desire to have a general purpose white-box tool (things can go very wrong with black box machine learning), we stick to unsupervised methods. In our recent paper in EPJ Data Science, we find that dictionary-based (unsupervised) sentiment analysis methods perform reliably on large documents (>10,000 words) with a few things in place:
- We show that a dictionary-based method will only perform reliably across corpora if the dictionary covers a sufficiently large enough portion of a given text’s lexicon, when weighted by word usage frequency. Summary: Make sure that your dictionary has most of the words in your documents!
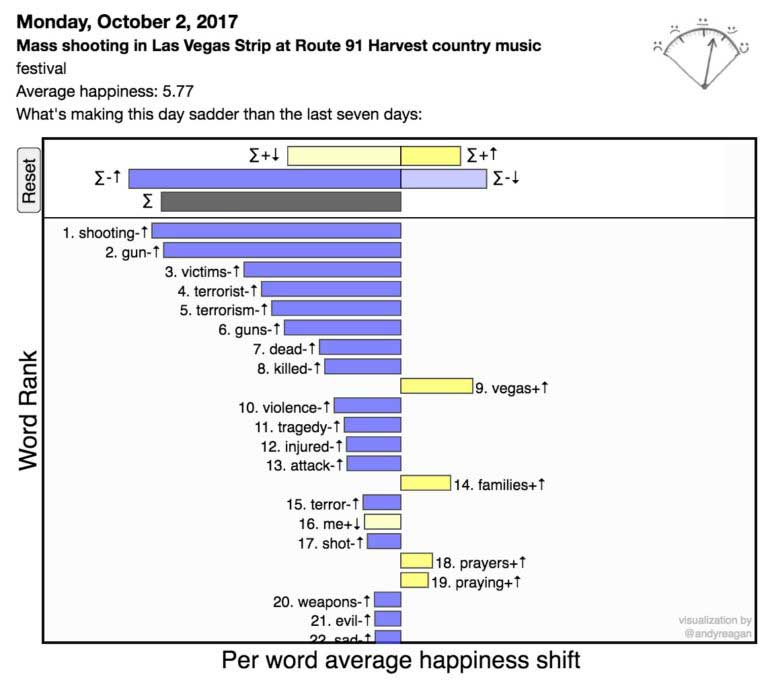
- We explicitly demonstrate that it is necessary to examine the words which contribute to changes in sentiment ratings. Common contextual error is something we can readily identify and correct for through word shifts, but would remain hidden to naive learning methods without new training. Given our results, we emphasize that doing any type of analysis without looking at the words is a fraught activity. Here is an example word shift graph for the saddest day that we have measured on Twitter, and you can see that there are positive words (e.g. ‘prayer’) alongside the negative words making this a very sad day:
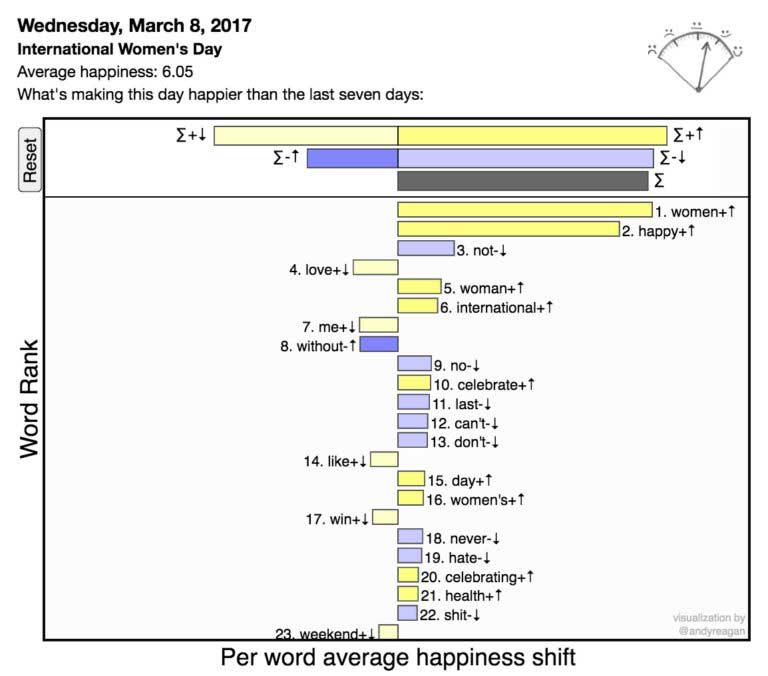
Here is an example word shift graph for a happier-than-average day on Twitter, International Women’s Day on March 3 this year:
- We show that a dictionary-based method will generate more meaningful word shift graphs if words are scored on a continuous scale. To interpret a sentiment score and understand the story behind the numbers, meaningful word shifts graphs are essential. The nuances in language are captured better.
Now that you have some ideas about what to look for in a dictionary, we suggest you look at Table 1 in our paper, and go measure some happiness!
*This blog post originally appeared on the SpringerOpen site, the publisher of EPJ Data Science.