

In this post, we'll run through the basic features of our new interactive happiness time series for Twitter. We'll first use words and pictures to orient your experience, and then finish with a video explanation.
Our method for measuring happiness, which we describe in a companion post and more fully in our foundational papers, relies on perceived happiness scores for individual words. The scale we use is 1 to 9, with 1 meaning extremely negative, 5 neutral, and 9 extremely positive. Our general experience with our measure is that scores for texts range between 5 and 7.
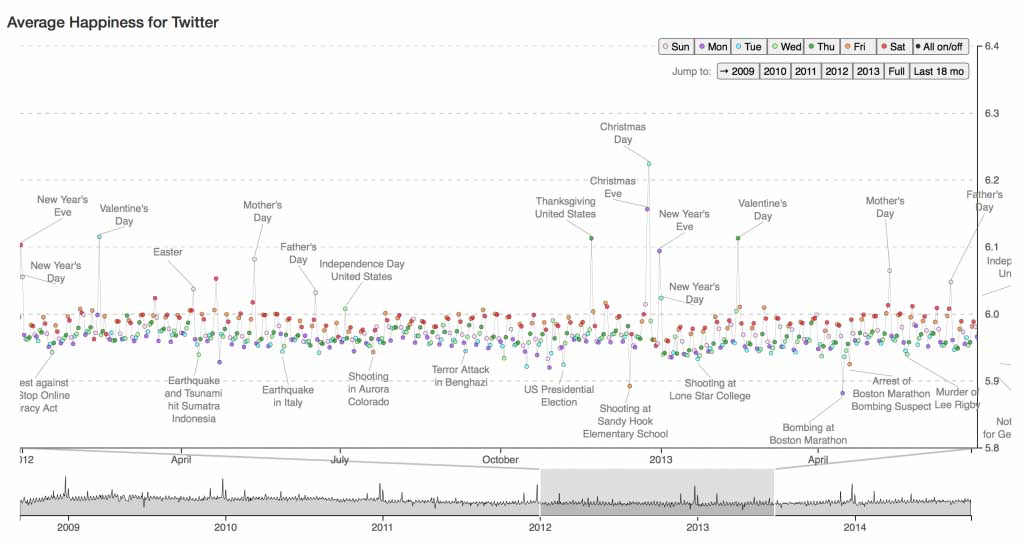
When you first visit hedonometer.org, you'll see the daily happiness time series for the most recent 18 months of Twitter. For this overall visualization, we've analysed around 10% of all tweets going back to the end of 2008 using our English language Hedonometer (we'll be adding time series for more languages soon). Here's an example 18 month view starting around January, 2012:
Hedonometer time series with the slider active. Click for interactive versin.
The main elements of the time series are:
- Circles whose heights represent daily average happiness scores. These circles are color-coded for day of the week, and the menu in the top right corner allows the colors to be toggled on and off.
-
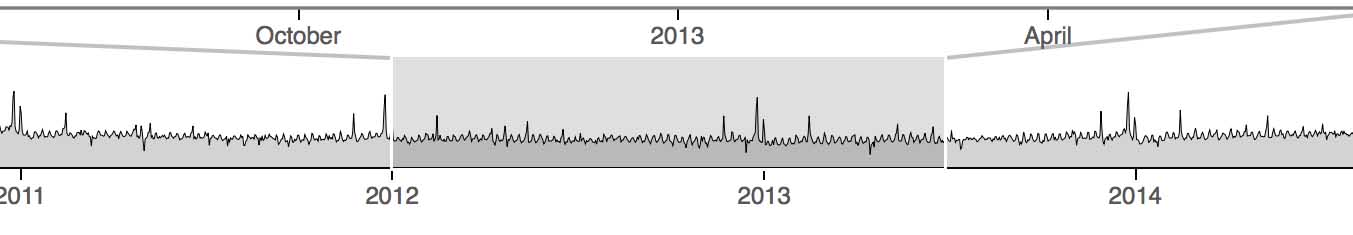
A slider at the bottom to allow movement back and forth along the time series,
as well as the ability to zoom in or out by grabbing its edges:
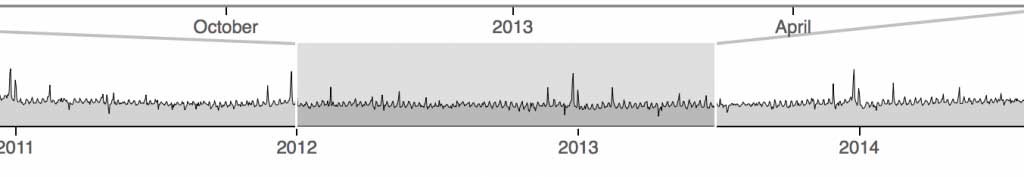
Time series selector.
- A curated set of "Major event" dates where our happiness measure jumps or drops unusually. For clarity, more events will appear as you zoom in, less will show as you zoom out.
-
Pop-up "Word shifts"—which we describe in detail in the companion post mentioned above—that
show how word usage changes contribute to a specific day's happiness difference
relative to the previous seven days.
Rolling over any date's circle will show a small pop up word shift, and clicking
on that word shift will bring up an interactive, richer version.
For major events, a link to the relevant Wikipedia entry will be included
in the full word shift.
Here's an example of the view you'll see for the death of Robin Williams:
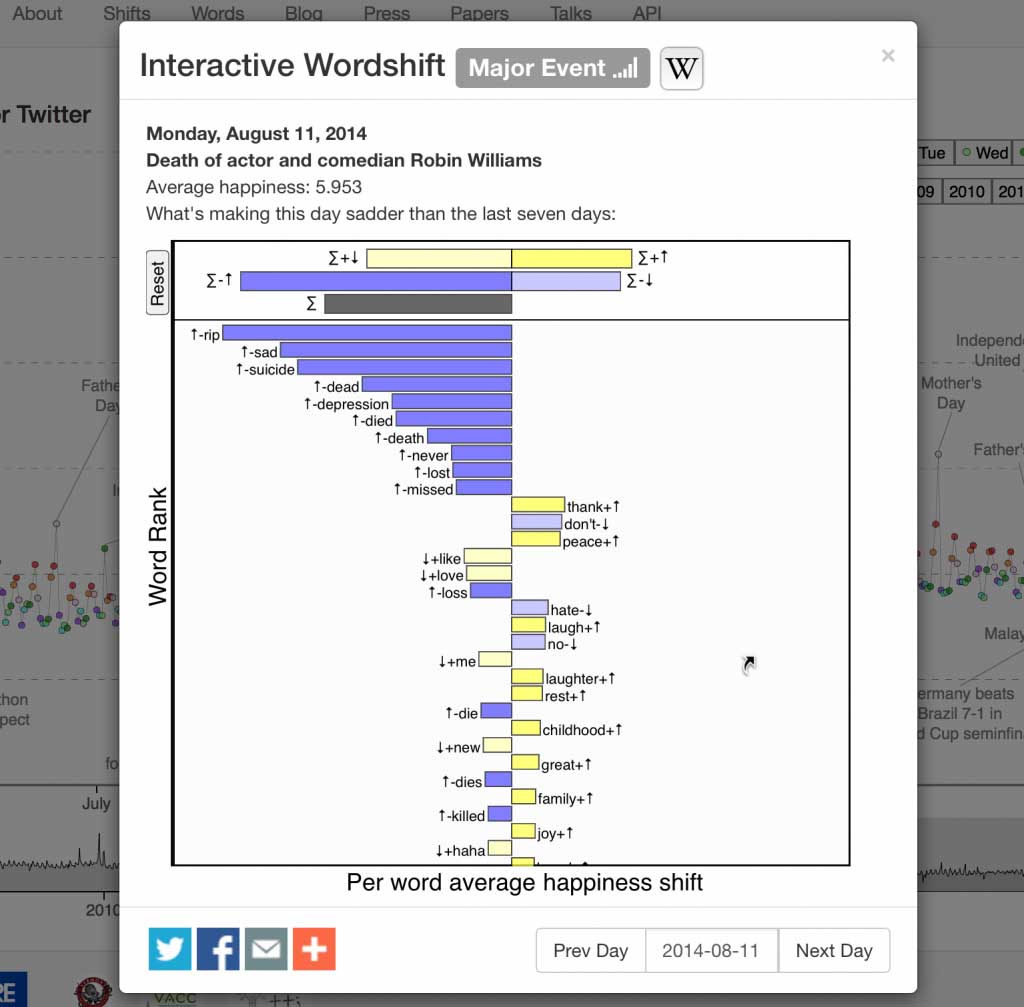
Word shift for Robin Williams's death. Click for interactive version.
- The very important ability to reliably share or bookmark any view you generate with the details stored in the full URL. You can either use the share buttons we provide or simply copy and paste the URL. Here's an example that will link directly to a view of 2012: https://hedonometer.org/index.html?from=2012-01-01&to=2012-12-31.
So, that's the basic story for our new time series, and now here's a short video explanation which will help as well: