
With our Hedonometer, we’re measuring how a (very capable) individual might feel when reading a large text—a day’s worth of tweets from New York City, the first chapter of Moby Dick, or the music lyrics from all UK pop songs released in 1983.
We’ll describe two fundamental pieces of the Hedonometer in this post:
- How our simple measure works;
- How to understand changes in happiness scores through our interactive word shifts.
More depth on everything below can be found in our foundational papers. Off we go:
Measuring happiness:
We measure the happiness of large-scale texts using what we call a lexical meter. (We’ll be introducing two other kinds of meters in the near future: ground truth meters and bootstrap meters.)
Lexical meters assess a given quality of a text (e.g., expressed happiness) by averaging over the contributions of that same, already measured quality for the text’s individual words (and potentially phrases).
For happiness, we have lists of average happiness scores for around 10,000 commonly used words in 10 languages, each deriving from the personal evaluations of 50 people. Scores were made on a 1 to 9 integer scale with 1 meaning “I feel extremely sad”, 5 meaning “I feel no emotion”, and 9 meaning “I feel extremely happy.” (See Likert scales for more.) The happiness scores of a few example words are \( h_{\textrm{avg}}(\textrm{'war'}) = 1.80\), \( h_{\textrm{avg}}(\textrm{'the'}) = 4.98\), and \( h_{\textrm{avg}}(\textrm{'laughter'}) = 8.50\).
Now, not all words convey emotion and some words are ambiguous or difficult to rate. We’ve found that we can apply a simple “word lens” to improve and tune the Hedonometer by analysing texts using words with enough clear emotional content. We’ve found a good default lens excludes all words for which \( 4 \lt h_{\textrm{avg}} \lt 6 \) (this is one principled way of finding stop words). We also allow users to choose any lens they like, as we explain here. Again, see our foundational papers for more. We’ll write \( L \) as the set of all words allowed by a particular lens choice.
You can explore all of our English words here and download the entire data set using our API.
So, given a word lens \(L\), we now score a text \(T\)'s happiness as the average of its component word scores: \[ h_{\textrm{avg}}^{(T)} = \frac{ \sum_{w \in L} h_{\textrm{avg}} {(w)} \cdot f_{w} } { \sum_{w \in L} f_{w} } = \sum_{w \in L} h_{\textrm{avg}} {(w)} \cdot p_{w} \] where \(h_{\textrm{avg}} {(w)}\) is the average perceived happiness of word \(w\), \(f_{w}\) is the frequency with which word \(w\) appears in \(T\), and \( p_{w} = \frac{f_{w}}{\sum_{w \in L} f_{w}} \) is the normalized version of \(f_{w}\).
Interactive Word shifts:
Okay, now that we can measure happiness (or any other quantity for which we have a lexical, ground-truth, or bootstrap meter), we need to understand why scores go up and down. There are many sentiment measures around but for the most part they are opaque in their workings. The linearity of our measure allows us to show in great detail why one text is happier than another through what we call word shifts.
Word shifts give us reason to trust our measure, to discover how to improve it, and the ability to explore happiness changes for which we do not have immediate intuition. They require some concentration to grasp but once you understand them, you’ll be very pleased with the rich information they provide. You can think of them as sophisticated word clouds.
We’ll present a little math first, then a few pictures, and tie everything up with a video. We’ll reprise and simplify the explanation for word shifts we gave in our 2009 PLoS ONE paper on Twitter happiness (p. 10).
Let’s say we have two texts which we call ‘reference’, \({T}^\textrm{(ref)}\), and ‘comparison’, \({T}^\textrm{(comp)}\). We want to know why the happiness of the comparison text, \(h_{\textrm{avg}}^\textrm{(comp)}\), is higher or lower than that of the reference text, \(h_{\textrm{avg}}^\textrm{(ref)}\).
We take the difference of their average happiness scores, rearrange a few things, and arrive at \[ h^{\textrm{(comp)}}_{\textrm{avg}} - h^{\textrm{(ref)}}_{\textrm{avg}} = \sum_{w \in L} \underbrace{ \left[ h_{\textrm{avg}} {(w)} - h^{\textrm{(ref)}}_{\textrm{avg}} \right] }_{+/-} \underbrace{ \left[ p_w^{\textrm{(comp)}} - p_w^{\textrm{(ref)}} \right] }_{\uparrow/\downarrow}. \]
Each word contributes to the word shift according to its happiness relative to the reference text (\({+/-}\) = happier/sadder), and its change in frequency of usage (\(\uparrow/\downarrow\) = more/less). We normalize the word shift contributions of each word so that they sum to \(\pm\)100 (the sign depends on whether happiness goes up or down), and order them by absolute value for the default word shift view.
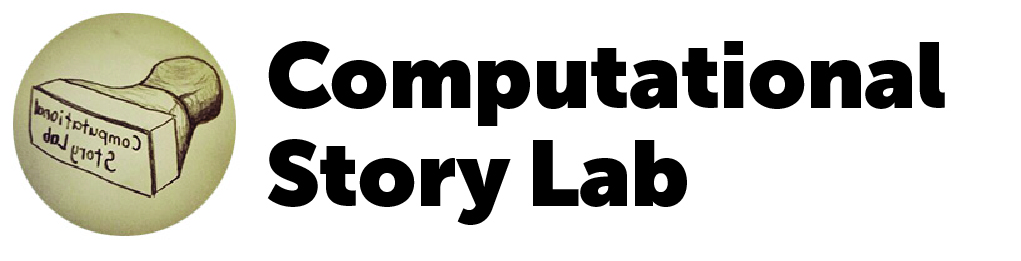
Below is a word shift for Robin Williams’s tragic death where the reference text is 10% of all tweets from the previous seven days, and the comparison text is 10% of all tweets from the day he died. We will explain everything in the following section, but immediately we see a preponderance of negativity with the words ‘RIP’, ‘sad’, ‘suicide’, ‘dead’, and ‘depression’ increasing the perceived sadness of the day, while there is also an increase in ‘thank’ and ‘laughter’. The length of the bars at the top of the shift give the combined contribution of the four ways individuals words can change the happiness score, and as demonstrated in the video at the end of this post, these bars can be clicked on to focus on only words of their kind.
Word shift showing how happiness dropped on Twitter for the day of Robin Williams’s death compared to the previous seven days. Click for interactive version.
Let’s get to these four types of words. When combined, a word’s relative happiness (\({+/-}\)) and change in frequency usage (\(\uparrow/\downarrow\)) give how the word contributes to the change in happiness between the two texts, which can occur in one of four ways. We’ll move through viewing modes for the word shift above to demonstrate.
-
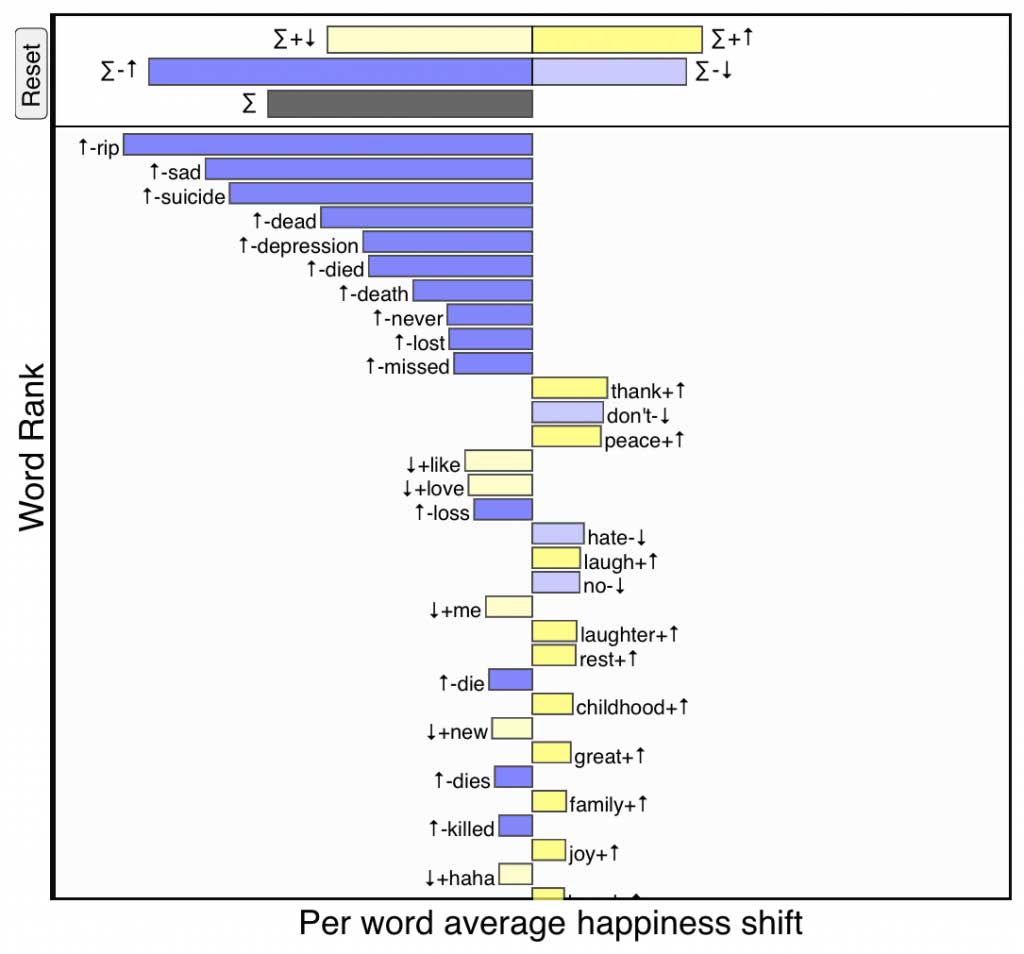
\(+\)\(\uparrow\), strong yellow:
Increased usage of relatively positive words—If a word is
happier than text \(T_{\rm ref}\) (\(+\))
and is being used more in text \(T_{\rm comp}\) (\(\uparrow\)),
then it makes the comparison text happier.
Positive words being used more frequently on the day of Robin Williams’s death. Click for interactive version.
-
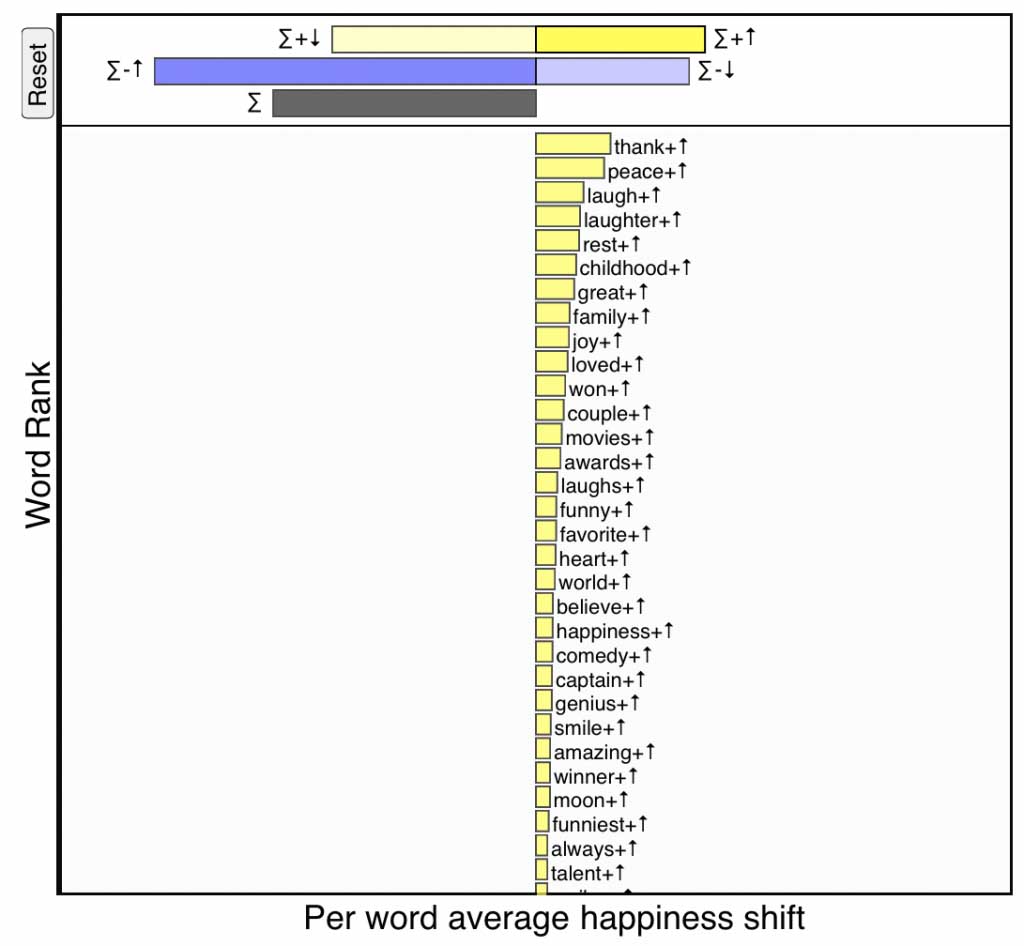
\(-\)\(\downarrow\), pale blue:
Decreased usage of relatively negative words—If a word is
less happy than text \(T_{\rm ref}\) (\(-\))
and appears relatively less often in text \(T_{\rm comp}\) (\(\downarrow\)),
then it also makes the comparison text happier.
Negative words being used less frequently on the day of Robin Williams’s death. Click for interactive version.
-
\(+\)\(\downarrow\), pale yellow:
Decreased usage of relatively positive words—If a word is
happier than text \(T_{\rm ref}\) (\(+\))
and appears relatively less often in text \(T_{\rm comp}\) (\(\downarrow\)),
then it makes the comparison text sadder.
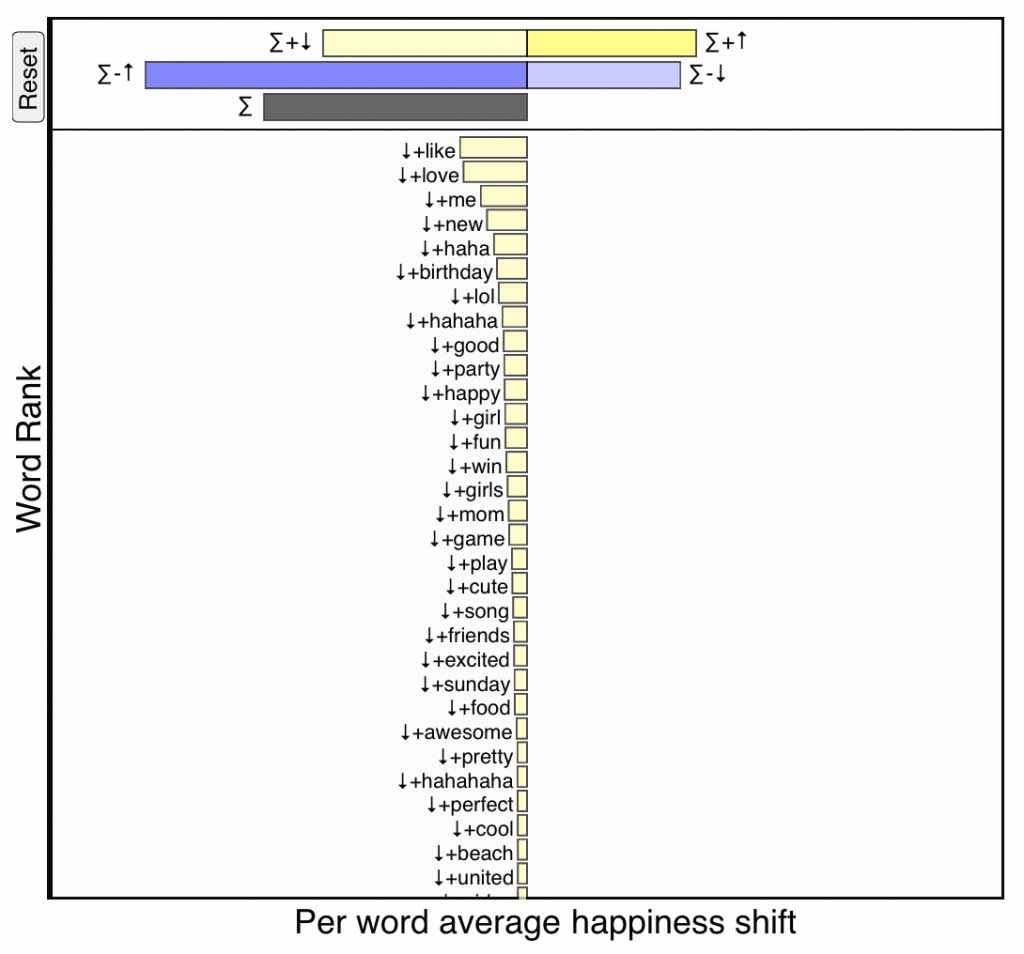
Positive words being used less frequently on the day of Robin Williams’s death. Click for interactive version.
-
\(-\)\(\uparrow\), strong blue:
Increased usage of relatively negative words—If a word is
less happy than text \(T_{\rm ref}\) (\(-\))
and appears relatively more often in text \(T_{\rm comp}\) (\(\uparrow\)),
then it also makes the comparison text sadder.
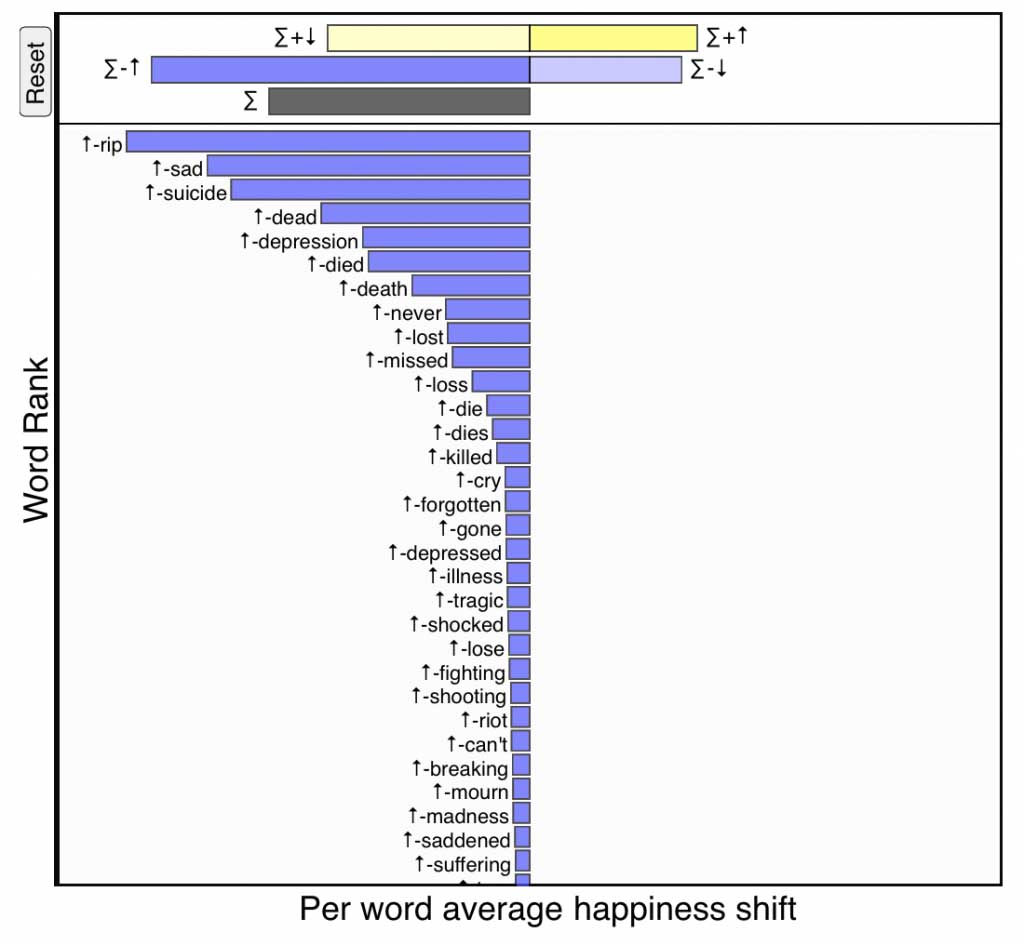
Negative words being used more frequently on the day of Robin Williams’s death. Click for interactive version.
So that’s the end of our description. The short video below shows how our interactive word shift works for our global Twitter time series, and will help reinforce what we’ve laid out above. Please spend some time exploring the shifts, returning to this explanation as you need to.