

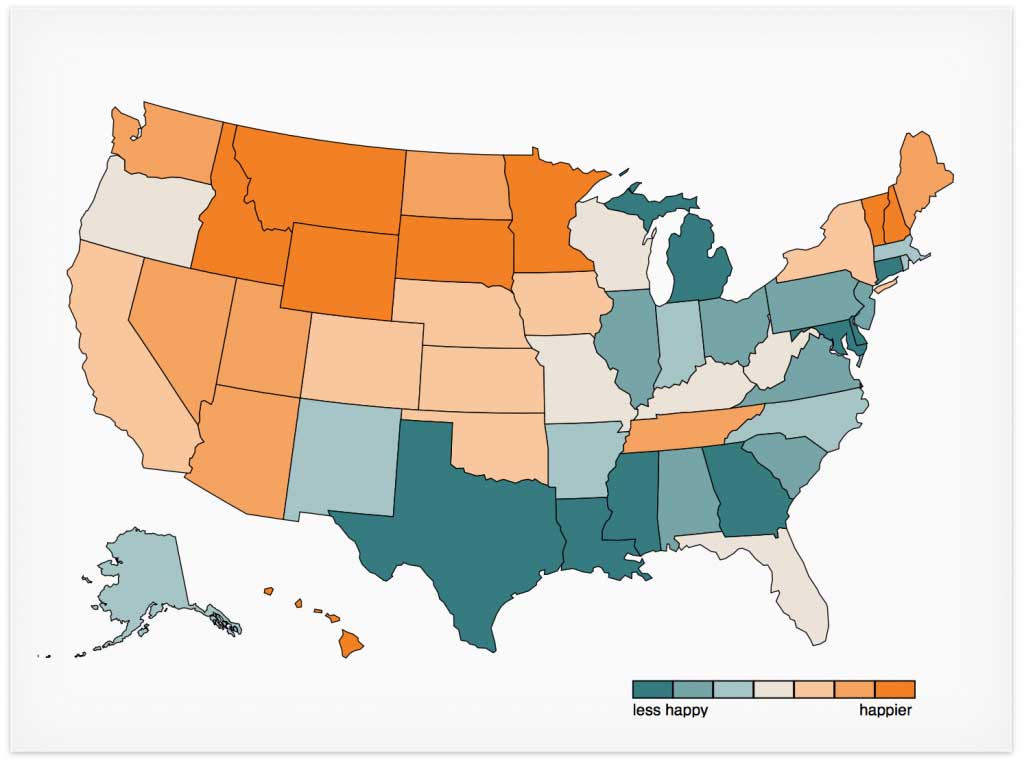
Geography of Happiness for the US
Over the summer of 2014, we have worked very hard to bring many new pieces to our Hedonometer, and we're pleased to tell you about what we've done, and where we're going next.
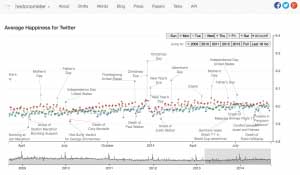
Snapshot of Hedonometer 2.0's happiness time series.
All along, one of the central goals for the Hedonometer has been to provide a new instrument for society's dashboard, one that measures population-level happiness in real time from any streaming text source. Like flying a plane, where we would never want just one dial with the limits "all good" and "uh-oh", we need a sophisticated dashboard to quantify how well a population is faring. We want to see unconventional measures like ours added to traditional, easier-to-gauge quantities often concerned with economic activity. Money doesn't equal happiness. We hope the Hedonometer will enable individuals, journalists, policy makers, corporations, and other research teams in their various pursuits.
Because our Hedonometer works for any large text, we're able to explore other areas for basic science purposes, particularly the vast realm of sociotechnical systems and the digital humanities. And some of our work will be simply just for fun (hopefully yours and ours).
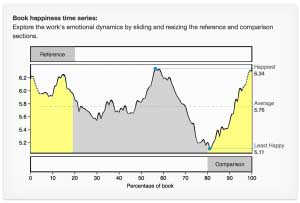
Harry Potter and the Prisoner of Azkaban.
As you'll see below, we have many plans for the future. So far, we've received crucial support from the NSF and the MITRE Corporation, and we're always looking for more ways to continue to lift our enterprise. If you're interested in or have suggestions about funding our work, please contact us.
Okay—here's what we've put together. We now have four main interactive views of emotion up and running:
- A completely rebuilt global Twitter happiness time series in English, updated daily and with powerful new word shifts;
- An interactive map of happiness for the 50 US States plus DC, also based on Twitter;
- A ranked list of cities by happiness for the US (Twitter again);
- and an explorable visualization of the emotional plot trajectories of 10,000 books in 10 major languages including Harry Potter along with classic and obscure works.
We'll go into more depth about how to use and share these visualizations in our following blog posts. As always, Hedonometer stands on a team effort but we have to acknowledge and praise Andy Reagan (@andyreagan) for his incredible efforts in leading the charge to Hedonometer 2.0. Building things is fun.
Some of the many new elements we're looking to add in the next year are:
- Other kinds of real-time, population-scale meters based on word usage including sleep, food consumption, exercise, binge-drinking, and boredom. We'll apply these meters to Twitter but they could in principle be used on any text.
- Global Twitter happiness time series and maps for all 10 languages: English, Spanish, French, German, Brazilian Portuguese, Indonesian, Korean, Simplified Chinese, Arabic, and Russian;
- Real-time Twitter happiness at 1 minute time scales.
- An interactive world map with the ability to explore at scales of country, state, city, and district (or equivalents).
- Simple ways to embed our interactive visualizations into webpages;
- A simple interface for uploading and comparing two texts, and for generating shareable visualizations;
- Phrase-based rather than word-based analysis in English;
- More stand-alone projects such as interactive visualizations of music lyrics over the last 60 years;
- Measures based on other major emotions such as fear, disgust, anger, and surprise.
We also have two longer-term, major projects in development:
- A fast search facility in the Hedonometer for users to find the emotional spectrum around specific words or phrases. This is a computationally bundensome problem. We'll be able to show how the emotional texture of how people are talking about an event or a product.
- Storybreaker: a real-time extractor of stories and narratives emerging around major events. Our algorithm will include emotion but our goal is to measure frames around issues and ultimately meaningful stories.
One last thing: we've moved our blog from onehappybird to compstorylab.org. All old links will still work.