Stacks Image 3
Stacks Image 3

Blog


Hedonometer 2.0

Over the summer of 2014, we have worked very hard to bring many new pieces to our Hedonometer, and we're pleased to tell you about what we've done, and where we're going next. All along, one of the central goals for the Hedonometer has been to provide a new instrument for society's dashboard, one that measures population-level happiness in real time from …

Continue Reading

How does movement influence your daily happiness?

Imagine commuting an hour to work, one way, grinding through miles of traffic to get from your suburban home to a desk job in the big city. Excited yet? Ok, now imagine that you lead a life of leisure traveling the world. You fly coast-to-coast to see a concert, soak in some culture, and drink fine wine. Does this lifestyle seem more appealing? Lets try to quantify the …

Continue Reading

Now published: The Geography of Happiness

Today we're pleased to announce that our article “The Geography of Happiness: Connecting Twitter sentiment and expression, demographics, and objective characteristics of place” has been officially published by PLoS ONE.  We wanted to tell you about one key piece we've added to the paper and an unusual new Twitter account we've created. After our three blog posts (which …

Continue Reading

A data-driven study of the patterns of life for 180,000 people

Here at the Computational Story Lab, some of us commute by foot, some by car, and a few deliver themselves by bike, even in the middle of our cold, snowful Vermont winter.  Occasionally, we transport ourselves over very long distances in magic flying tubes with wings to attend conferences, to see family, or for travel.  So what do our movement patterns look like over time?  Are …

Continue Reading

Where is the happiest city in the USA?

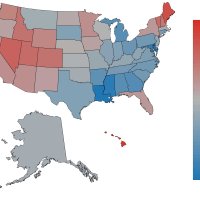
(Update: this work is now published at PLoS ONE) Is Disneyland really the happiest place on Earth?* How happy is the city you live in? We have already seen how the hedonometer can be used to find the happiest street corner in New York City, now it's time to let it loose on the entire United States. We plotted over 10 million geotagged tweets from 2011 (all our results are in …

Continue Reading

Question: Where is the happiest place in New York City?

Possible answers: Immediately adjacent to any hot dog stand. Madison Square Garden during moments of Linsanity. Tim Tebow's new apartment building. No really though, let's measure some stuff. Facts: (1) New York City is the most populous city in the US and (2) Manhattan streets are arranged on a rectangular grid. We have already seen how cities, airports, and even streets …

Continue Reading

Tweet cartography

Six months of geo-located messages from Twitter's gardenhose feed, roughly 20 million.  World, US, and NYC twitterific projections. PDF versions available here. Made possible by data ninjas Kameron Harris and Morgan Frank. …

Continue Reading

Please Note: Twitter feeds are currently not displaying due to an update made by Twitter. Click on “Tweets from @compstorylab” below and log into your Twitter account to view.